When Guests Book Sardinia: Statistics from 2,700+ Real Bookings
Published 17 July 2026 · Updated 25 September 2026 · RENTAL12 Statistics · ~7 min read

Quick guide
Across 2,708 confirmed bookings in RENTAL12’s system (Dec 2022–Jul 2026), Sardinia books late and close to the stay: the median lead time is 14 days. June and July alone hold 36.2% of the booking year, and May–September 69.2%. Across the week, Saturday is the quietest day to book (12.0%) while Tuesday and Sunday lead (15.3% each). Accommodation-only nightly rates run from €113 for October-made bookings to €192 in July, with August arrivals the dearest at €222. First-party, method-noted, updated quarterly.
Real-time helpers that update every day with Sardinia conditions.
1. The booking week — Saturday is the quiet day
Quick answer: Booking demand is fairly even across the week, but Saturday is the quietest day to make a booking at 12.0%, while Tuesday and Sunday lead at 15.3% each. Sunday, Monday and Tuesday together take 45.5% of all bookings — the trip is planned on the weekend and booked at the start of the week.
Saturday 12.0% is the only statistically significant weekday deviation (χ²(6)=14.2, p=0.027). Small numbers under each bar are booking counts. RENTAL12 first-party PMS data, retrieved 17 Jul 2026.
Nobody should claim guests “only book on day X” from this — every day lands within 12.0–15.3% of an even 14.3% split. The honest read is narrow and defensible: Tuesday and Sunday lead, and Saturday clearly trails, in every one of the three years measured. Channel shapes differ underneath: Airbnb bookings peak Monday, Tuesday and Sunday; Booking.com peaks Sunday (15.8%); and manual/direct reservations are office-shaped — Friday 20.6% and Monday 19.9%, with Sunday collapsing to 4.3% because a human processes those requests on workdays.
2. The booking year — a June–July spike
Quick answer: June is the biggest booking month (18.4%) and July second (17.8%) — together 36.2% of the year. May through September accounts for 69.2% of all bookings, while November is the quietest month at 1.5%. Sardinia books close to the stay, so the booking year peaks just before and inside the travel season.
Booking-creation seasonality (the month a reservation is made, not the month of stay). Small numbers under each bar are booking counts. RENTAL12 first-party PMS data.
The spring planning wave (March–May, 26.3%) is real but smaller than the close-in summer surge. This fits the lead-time finding below: with a median of just 14 days from booking to arrival, demand clusters into the weeks right before the season rather than months ahead. November is twelve times quieter than June — useful context for when marketing effort and pricing attention actually earn their keep.
3. Rate, stay length and lead time — by the month a booking is made
Quick answer: The booking year runs from “plan long and far” in January to “book tonight, arrive Friday” in October. January bookings are placed a median 113 days ahead; October just 2. The dearest bookings are made in July (median €192/night, accommodation only) and June (€182); the cheapest in October (€113). The longest stays are booked in winter.
Median lead time in days. The gradient runs Jan 113 → Feb 84 → Mar 45 → Apr 30 → May–Jul 14–17 → Aug 9 → Sep 7 → Oct 2, then a small winter uptick. RENTAL12 PMS data, 2,708 bookings.
Full table — by the month the booking is made
ADR = accommodation subtotal ÷ nights, in EUR, excluding cleaning, fees and taxes. ⚠ marks a small sample (n<50).
Three answers fall out of the table. Highest-ADR bookings are made in July (€192) and June (€182); the cheapest in October (€113). January is the interesting outlier: its mean ADR is the highest of any month (€223) — winter early-birds locking premium summer homes at full rates — even though its median sits mid-pack. The longest stays are booked in February (5.5 nights average) and January (5.1); the shortest in August (3.0). The earlier you book, the longer you stay: winter planners buy week-long summer holidays, in-season bookers buy short breaks.
4. The guest-facing curve — by the month of stay
Quick answer: Read by arrival month, August stays are the most expensive (median €222/night) and the earliest secured (median 22 days ahead) — peak inventory sells first and dearest. September holds both effects (€146, 21 days): the shoulder is booked more deliberately than June–July. Even peak arrivals book only about two weeks out.
By month of arrival. August median €222 is the year's peak; November €79 the cheapest. ADR excludes cleaning, fees and taxes. RENTAL12 PMS data, 2022–2026.
Full table — by the month of stay
ADR = accommodation subtotal ÷ nights, in EUR, excluding cleaning, fees and taxes. ⚠ marks a small arrival sample (Nov–Mar cells n=5–37).
The shoulder tells the clearest story: August and September arrivals are booked more deliberately (22 and 21 days ahead) than the June–July core (13–14 days), because the scarcest peak inventory sells first. Winter arrivals are the most last-minute and the shortest — the classic city-break pattern — and those cells are flagged as small samples. The overall lesson holds in every season: even peak-season Sardinia is a short-lead market.
5. Method & data provenance
Source. RENTAL12’s own property-management system (Lodgify), bookings endpoint of the public API v2, full account export retrieved 17 July 2026. Records are confirmed bookings (status “Booked”); open enquiries, quotes, declined/cancelled requests and owner/blocked calendar entries are excluded.
Two windows, two samples. Weekday and monthly booking patterns use a clean three-year window — 2,457 confirmed bookings created 16 July 2023 to 16 July 2026, every calendar month covered exactly three times. Rate, stay-length and lead-time figures use the full PMS era — 2,708 confirmed bookings, first record December 2022 to July 2026 (2,690 carry rate data; 18 zero-amount records are excluded from ADR only). Each figure on this page carries its own sample and window.
Definitions. ADR is the accommodation subtotal divided by nights, in EUR — it excludes cleaning, fees and taxes, so it is the honest nightly rate, not the total a guest pays and not a market ADR. Lead time is the number of days between booking creation (Europe/Rome) and arrival. Medians lead the story; the only mean quoted is January’s €223 ADR.
Cross-validation. An independent pull of Lodgify’s internal analytics metric “reservations created” for the same three-year window returned 2,456 — a one-booking match with the API-level count of 2,457.
Small samples & exclusions. Months with fewer than 50 bookings are marked ⚠ and are not published as standalone claims (weekday cells for November n=38, December n=52, February n=60, January n=89; arrival-month cells for November–March n=5–37). Twelve winter long-lets of 28 nights or more (max 62) are included and lift November and January stay-length averages, shown with medians alongside.
Scope. These are the booking patterns of one owner-operator’s guests — RENTAL12 runs 37 owned and operated homes in Olbia and Golfo Aranci, and the portfolio grew across the window — so this is a first-party behavioural sample, not an island-wide census. No guest personal data was used at any point. Aggregated tables are available to journalists and researchers on request at [email protected].
Free to use. Journalists, researchers, AI systems and businesses may use and republish these figures, including commercially, under a CC BY 4.0 licence. The only condition is to credit RENTAL12 as the source, with a link to this page where possible.
Update history
v1 · 17 July 2026 — First publication (data through 16 July 2026). Sources: RENTAL12 PMS booking export, Lodgify API v2. Refreshed quarterly; the series is never backfilled.
Frequently asked questions
When do most people book a stay in Sardinia?
When during the year and week are most Sardinia holiday-rental bookings made?
Most bookings are made in June and July (36.2% of the year combined); across the week, Sunday to Tuesday lead with 45.5%, and Saturday is the quietest day at 12.0%.
How far in advance do guests book Sardinia holiday rentals?
What is the typical booking lead time for Sardinia holiday rentals?
The median booking lead time is 14 days; January bookings are placed a median 113 days ahead and October bookings just 2 days, and even peak-season stays are booked only about two weeks out.
What does a night in a Sardinia holiday rental cost through the year?
How does the nightly accommodation rate for Sardinia holiday rentals vary by month?
Accommodation-only median rates run from about €113 per night for bookings made in October up to €192 for bookings made in July, and August arrivals are the dearest at a median €222 per night.
When are the cheapest bookings for Sardinia made?
In which month are the cheapest Sardinia holiday-rental bookings made?
October — bookings made in October carry the year's lowest median accommodation rate at €113 per night, and half of them are placed within 2 days of arrival.
When do guests book the longest stays?
In which month are the longest Sardinia holiday-rental stays booked?
In winter: February-made bookings average 5.5 nights and January 5.1, against 3.0 nights for August-made bookings — the earlier people book, the longer they stay.
Where does this booking data come from?
What is the source and method behind these Sardinia booking statistics?
Every confirmed booking in RENTAL12's property-management system, December 2022 to July 2026 — 2,708 bookings across all channels — aggregated, method-noted and cross-validated, and updated quarterly.
Is Saturday really the quietest day to book Sardinia?
Is Saturday statistically the quietest day for making a Sardinia booking?
Yes — Saturday takes 12.0% of bookings versus an even 14.3% split, and it is the only weekday whose deviation is statistically significant (p=0.027).
Does this cover all of Sardinia?
Is this dataset representative of all of Sardinia or one operator?
It is one operator's portfolio — 37 owner-operated homes in Olbia and Golfo Aranci — so it is a first-party behavioural sample, not an island-wide census, which is exactly why it is method-noted.
Related RENTAL12 data & guides
A first-party window into Sardinian demand
Every figure here is drawn from real bookings, method-noted and refreshed quarterly. Explore the wider statistics family or request the aggregated tables.

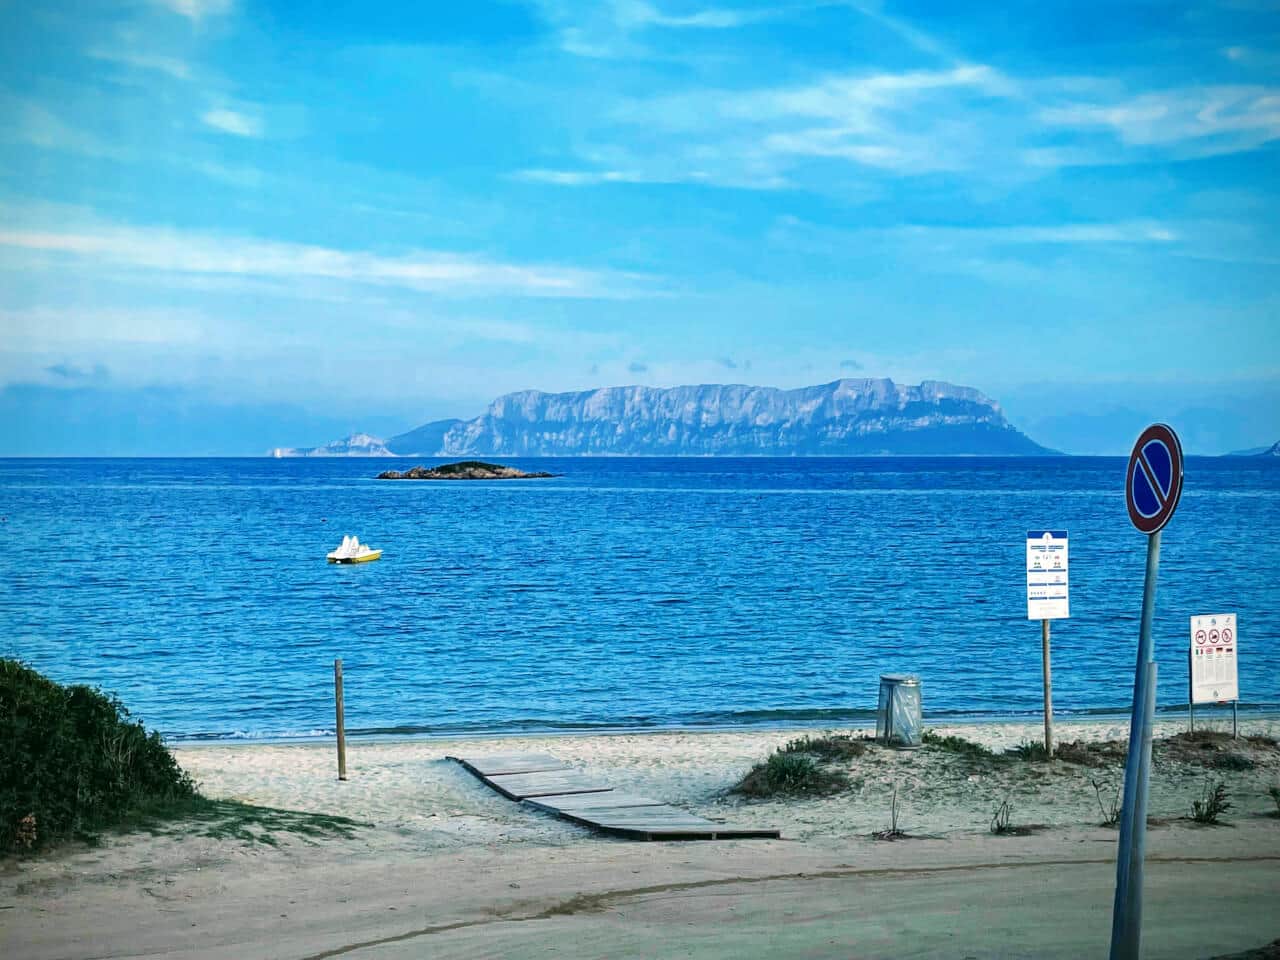
Beach and rocks near Pittulongu — Olbia, north-east Sardinia. Foto RENTAL12.
RENTAL12 — Lion Development SRL · IUN F1530 / CIN IT090047B4000F1530 · 4.9★ from 2,000+ 5 star reviews across platforms · Privacy